Undervalued Goldfield Corp, Well Positioned For Continued Growth
 One of the cheapest stocks in our Acquirer’s Multiple, Small & Micro Cap – Stock Screener is Goldfield Corp (NYSEMKT:GV).
With a market cap around $136 million, few investors have ever heard of this great little micro-cap.
Goldfield Corporation (Goldfield), is a leading provider of electrical construction and maintenance services in the energy infrastructure industry primarily in the Southeast and mid-Atlantic regions of the United States and Texas. The company specializes in installing and maintaining electrical transmission lines for a wide range of electric utilities. Goldfield is also a real estate developer of residential properties on the east coast of Florida.
Goldfield flies under the radar of most institutions simply because of its size. In fact, there are no analysts currently covering the stock but according to Nasdaq.com, the company had thirteen new institutional shareholders as of December 31, 2016.
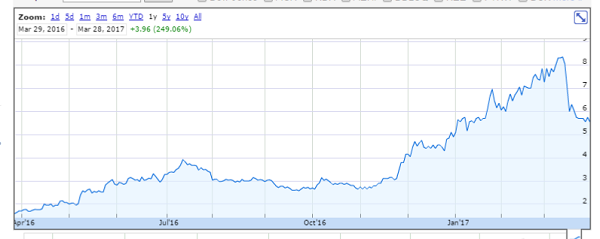
A quick look at the company’s share price over the past twelve months shows the stock has risen 249% to $5.55, just 4% off its 52 week high of $5.80.

(SOURCE: GOOGLE FINANCE)
Latest Results
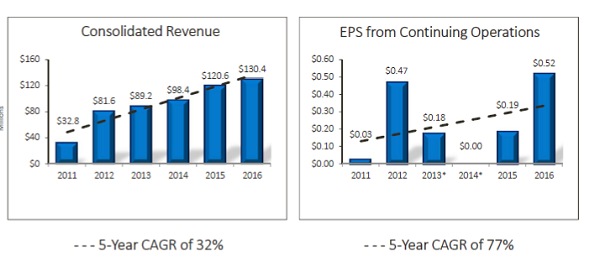
Goldfield recently released its FY 2016 and Q4 2016 results. The company reported record revenues for the fifth consecutive year stating revenue increased 8.2% to a record $130.4 million from $120.6 million for the previous corresponding year of 2015. The increase was attributed to continued growth in fixed-price contracts and other electrical construction work.
Other highlights included:
- Income from continuing operations before taxes increased 155.0% to $20.9 million from $8.2 million, fueled by a 93.2% growth in electrical construction operations income before income taxes, resulting from higher revenue from several large projects and sharply improved margins.
- Net income grew to a record $13.0 million, or $0.51 per share, from $4.5 million, or $0.18 per share.
- Margins on electrical construction operations operating income increased to 19.7% from 11.0% due to improved performance on several projects.
- EBITDA grew to $27.6 million from $14.9 million as a result of the same factors which drove the growth in pre-tax operating income.

(SOURCE: COMPANY REPORTS)
Regarding the latest results, Goldfield’s President and Chief Executive Officer John H. Sottile said, “We are proud of our accomplishments in 2016, as revenue grew 8.2% and earnings per share improved 183% over 2015. In 2016, we also realized our fifth consecutive year of record revenues. We believe that the strategies which helped us achieve these milestones will continue to serve us well. Additionally, over the past five years our revenue has grown nearly 300 percent while earnings improved from $0.03 per share to $0.51 per share. This demonstrates our ability to grow our business, strengthen our operations and deliver results to our stockholders while successfully and safely executing projects and meeting the needs of our customers. We anticipate continuing strength in infrastructure spending, particularly in transmission construction, and believe we are well positioned to secure new projects in our markets.”
It’s a remarkable achievement for a company that works in what is seen by most investors a fairly boring industry, energy construction and maintenance. Goldfield’s growing revenues and strong margins are due mainly to its strong geographic footprint in the Southeast and mid-Atlantic regions of the United States and Texas, combined with a large modern fleet of equipment in each of its locations that maximize efficiency and minimize downtime.
While the electrical construction business remains highly competitive and fragmented, Goldfield provides services through its subsidiaries, Power Corporation of America, Southeast Power Corporation and C and C Power Line, Inc and its important to note that the company derives a significant portion of its electrical construction revenue from just a small group of customers. For example, for the years ended December 31, 2016 and 2015, three of its customers accounted for approximately 58% and 62% of consolidated revenue.

(SOURCE: COMPANY REPORTS, AMOUNTS IN MILLIONS)
While the company doesn’t state which customers make up the top three positions, a quick look through the company’s latest 10-K shows customers include:
- Santee Cooper (South Carolina Public Service Authority)
- Florida Power & Light Company
- CPS Energy
- Lower Colorado River Authority
- Central Electric Power Cooperative, Inc
- Duke Energy Corporation
- Orlando Utilities Commission
- Lee County Electric Cooperative
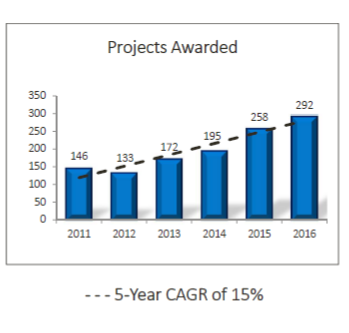
Goldfield has a great track record of retaining its customers and completing its projects based mainly on its strict policy of committing only to an amount of work that the company believes it can properly supervise, equip and complete to the customer’s satisfaction and timetable. A quick look at the company’s latest investor presentation shows Goldfield has a 5 year CAGR of 15% when it comes to projects awarded.

(SOURCE: COMPANY REPORTS)
Backlog
In addition its strong track record in project awards Goldfield also has a healthy backlog. As of December 31, 2016, the Company’s 12-month electrical construction backlog increased to $97.6 million from $84.7 million as of December 31, 2015. Total backlog, which includes total revenue estimated over the remaining life of a master service agreement (MSA) plus estimated revenue from fixed-price contracts, was $190.0 million as of December 31, 2016, compared to $202.9 million as of year-end 2015. This decline resulted from completion of some MSA work, not replaced by new work and the reduction in estimated work under certain MSAs.

(SOURCE: COMPANY REPORTS)
It’s also important to note that Goldfield’s backlog is estimated at a particular point in time which often understates future revenue in any particular period. For example, in December 2015 the company stated its twelve month backlog as $84.7 million but the company’s actual electrical construction revenue in 2016 was $125 million. Therefore electrical construction revenue exceeded the company’s estimated 2015 backlog by 48.5%.
Tailwinds
In addition to its healthy backlog, Goldfield is also well positioned to capitalize on some favorable industrial tailwinds, which include:
- President Trump’s plan to prioritize and jumpstart infrastructure projects around the country
- Competitive transmission solicitations spurred by FERC 1000 ruling
- Growing need for additional transmission to deliver new generation of natural gas and renewable energy resources to load centers
- Federal programs, including wind and solar projects, will increase infrastructure spending
Plus some region tailwinds that include:
Duke Energy:
- Constructing two 280-megawatt combined-cycled natural gas units in Asheville, NC to replace one 376-megawatt coal plant to be retired in 2020
- Building a 1,640 megawatt combined-cycle natural gas plant in Florida to replace two 1960s-era coal plants
Florida Power & Light:
- Strategically phasing out older, less efficient oil and coal-fired plants and replacing with advanced, fuel-efficient energy centers
- Investing to increase use of zeroemissions solar power with plans to install significantly more solar panels every year through at least 2020
EEI Investments
In addition to President Trump’s plan to prioritize and jumpstart infrastructure projects around the country, there’s another catalyst that should continue to drive growth for Goldfield, and that is the projected transmission investments by EEI members.
The Edison Electric Institute (EEI) is the association that represents all U.S. investor-owned electric companies. Its members provide electricity for 220 million Americans, operate in all 50 states and the District of Columbia, and directly and indirectly employ more than one million workers.
EEI member investments range from new relatively large-scale, high-voltage facilities to investments in upgrades and replacement of existing aging infrastructure to maintain reliability.
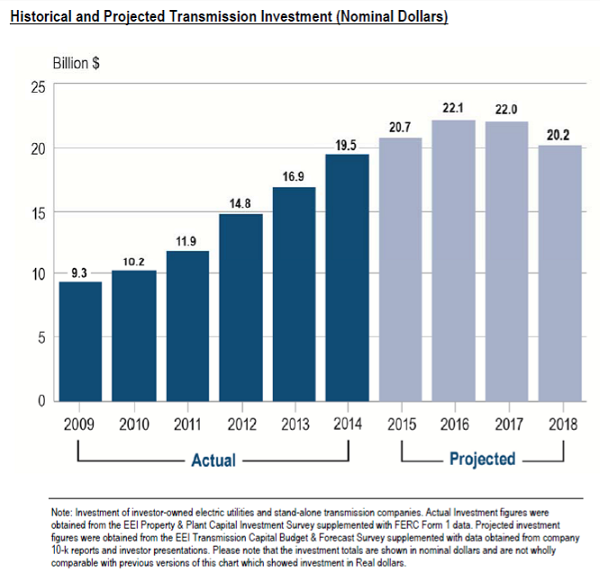
According to the EEI Actual and Planned Transmission Investments By Investor?Owned Utilities (2009?2018) Oct. 2015, transmission investments are projected at $22 billion in 2017 and $21 billion in 2018 driven by need to ensure grid reliability, integration of renewable energy, and upgrade of aging infrastructure throughout the U.S.

(SOURCE: EEI ACTUAL AND PLANNED TRANSMISSION INVESTMENTS BY INVESTOR?OWNED UTILITIES (2009?2018) OCT. 2015)
Strong Balance Sheet
Goldfield has stated, it will continue to, “Evaluate targeted, niche companies typically under the radar of industry acquirers”. The company is well positioned to seek out accretive acquisitions thanks to its very strong balance sheet and ability to generate free cash flows. A quick look at the company’s balance sheet below ending December 2016 shows that the company had cash and cash equivalents of $20.6 million and total debt of $22.3 million. Goldfield has grown its cash reserves through its operations from $8 million in December 2012, while its long-term debt has increased by just $2 million compared to December 2012.
| Fiscal Period (Amounts in Millions) | Dec16 |
| Cash And Cash Equivalents | 20.6 |
| Current Portion of Long-Term Debt | 6.1 |
| Long-Term Debt & Capital Lease Obligation | 16.2 |
(Source: Company reports)
Loads of Free Cash Flow
When you combine the company’s strong balance sheet with its significant amounts of free cash flow, you start to get an idea of the financial strength of this great little micro-cap.
A quick look at the company’s trailing twelve month cash flow statements below shows Goldfield’s generated $18.1 million (ttm) in operating cash flow. At the same time, the company had just $5 million (ttm) in capex, which equates to $13.1 million (ttm) in free cash flow. With a current market cap of $136 million that means Goldfield’s has a FCF/Price yield of 10% (ttm).
| Fiscal Period (Amounts in Millions) | Dec16 | Sep16 | Jun16 | Mar16 |
| Cash Flow from Operations | 7.7 | 6 | 7.1 | -2.7 |
| Capital Expenditure | -2.1 | -1.7 | -0.7 | -0.5 |
| Free Cash Flow | 5.6 | 4.3 | 6.4 | -3.2 |
(Source: Company reports)
Valuation
In terms of the company’s valuation. Goldfield’s has a current market cap of $136 million, with total debt exceeding the company’s cash and cash equivalents by $2 million, that means Goldfield has an Enterprise Value (EV) of $138 million. With $13.1 million (ttm) in free cash flow, that means the company has a FCF/EV Yield of 10%.
We favor EV over market capitalization as it includes additional liabilities–like debt, preferred equity and non-controlling interests–if you were to purchase the entire company. EV is calculated as:
Market Cap + Preferred Equity + Non-Controlling Interests + Total Debt – Cash and Equivalents.
With an Enterprise Value (EV) of $138 million and Operating Earnings* of $21 million (ttm), that means Goldfield’s is currently trading on an Acquirer’s Multiple of 6.45 or, 6.45 times Operating Earnings*.
The Acquirer’s Multiple is defined as:
Enterprise Value/Operating Earnings*
*We make adjustments to operating earnings by constructing an operating earnings figure from the top of the income statement down, where EBIT and EBITDA are constructed from the bottom up. Calculating operating earnings from the top down standardizes the metric, making a comparison across companies, industries and sectors possible, and, by excluding special items–income that a company does not expect to recur in future years–ensures that these earnings are related only to operations.
With a FCF/Price Yield of 10% (ttm), a FCF/EV Yield of 10% (ttm) and an Acquirer’s Multiple of 6.45, or 6.45 times Operating Earnings*, that places Goldfield’s squarely in undervalued territory.
Summary
Goldfield’s is a great little micro-cap that recently reported record revenues for the fifth consecutive year.
The company’s growing revenues and strong margins are due mainly to its strong geographic footprint in the Southeast and mid-Atlantic regions of the United States and Texas, combined with a large modern fleet of equipment in each of its locations that maximize efficiency and minimize downtime.
Goldfield has a great track record of retaining its customers and completing its projects based mainly on its strict policy of committing only to an amount of work that the company believes it can properly supervise, equip and complete to the customer’s satisfaction and timetable. Goldfield has a 5 year CAGR of 15% when it comes to projects awarded.
The company has a healthy backlog and is well positioned to capitalize on some favorable industrial tailwinds, which include President Trump’s plan to prioritize and jumpstart infrastructure projects around the country, and projected transmission investments by EEI members.
Goldfield’s has a very strong balance sheet and solid free cash flows and has started to generate interest from a number of institutions with thirteen new institutional shareholders as of December 31, 2016.
In terms of the company’s valuation. Goldfield is currently trading on a FCF/Price Yield of 10% (ttm), a FCF/EV Yield of 10% (ttm) and an Acquirer’s Multiple of 6.45, or 6.45 times Operating Earnings. Add to this the company’s P/E of 11, compared to its 5Y average of 14.5, and Goldfield’s remains squarely in undervalued territory.
Note: This article was contributed to ValueWalk.com by The Acquirer’s Multiple.
Category: Energy Stocks


