Steer Clear Of These Three Popular Closed-End Funds
 With my focus on higher yield investments, I often receive questions about various closed-end funds, often referred to as CEFs. CEFs are actively managed investment pools with shares that trade on the stock exchanges. A lot of these funds carry very attractive yields. The danger is that this is an asset class where it is hard to separate the good from the bad from the truly ugly. Here are some danger signs and CEFs that illustrate those dangers.
There are over 500 CEFs trading on the U.S. stock exchanges. A large portion of the funds own municipal bonds and pay dividends that are the pass-through vehicles for the tax-free interest paid by munis. These funds require different investment criteria and are a topic for another day. Today the focus is on CEFs in the taxable side of the investment universe. The group includes stock funds, bond funds, and hybrid funds.
Evaluating individual closed-end funds can be frustrating. Many fund managers are not very forthcoming about what they own in the portfolios and how they implement investment strategies. Here are some clues with examples that show potential closed-end fund problems.
Share price to NAV premiums. A defining feature of closed-end funds is that once a fund is launched, the management company will not buy back shares. Shares only trade on the stock exchange. That means a CEF will have two share prices, the market price and the net asset value (NAV). Both deep discounts and high premiums to NAV are danger signals. If you pay a premium for NAV shares, you are paying more than the portfolio assets are worth. Premiums can collapse, leading to losses in your fund investments.

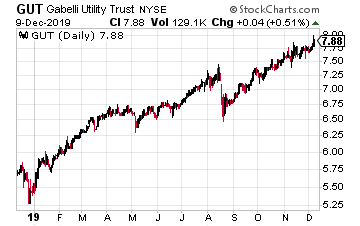
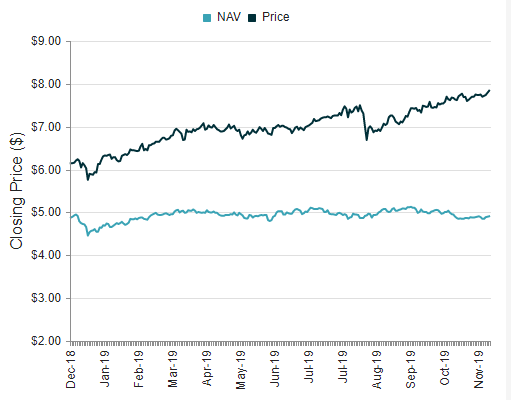
The Gabelli Utility Trust (GUT) currently trades at an eye-popping 59.7% premium to NAV. This means you pay almost $1,600 for $1,000 worth of fund assets. The chart shows how the share price has climbed much faster than the NAV, which has been stable throughout 2019.
From the price to NAV premium alone, this is a CEF to sell, not buy. If it was on an investor’s buy list, the best course is to wait until the spread again reaches a mid-teens percentage, comparable to where it was in August 2018.
Even though utilities are a hot sector, this closed-end fund is not worth the 7.6% yield.

CEF dividends are not always dividends. Closed-end funds can establish what is called managed distribution schemes. This lets a fund pay level dividends, even if the portfolio income is uneven.
What are paid as dividends may be portfolio income, realized capital gains, or even return of investor capital (ROC). While some ROC is not destructive to the portfolio value, it is a danger signal and may indicate the fund manager is selling assets to keep paying the dividend.
That will erode the NAV over time.

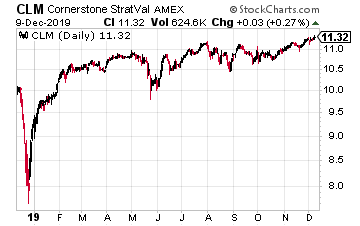
Cornerstone Strategic Value Fund (CLM) is a global equities fund with a 19.7% yield. CLM is paying a $0.2035 per share monthly dividend. Unfortunately, well over half of the dividend history for the last two years has been ROC.
For 2019, 72% of the dividends paid were classified as ROC. That’s almost three-quarters of each dividend coming back as a return of the investors’ own money.
The paying out of principal instead of earnings will lead to dividend cuts. To start 2020, this fund slashed the monthly dividend by 10%.
This fund is an example of a CEF with an eye-popping yield that, in reality, provides a false sense of investment gains. CLM is a fund to sell, not own.
Rising interest rates will be bad for bond funds. In the world of taxable CEFs, there are similar numbers of stock funds and bond funds.
For bond funds, an increase in interest rates will lead to falling bond prices. The longer the maturity of bonds owned, the steeper the price decline.
Preferred shares are bond-like investments that typically do not have maturity dates. In a rising rate environment, preferred stock shares will decline even more than bond prices.

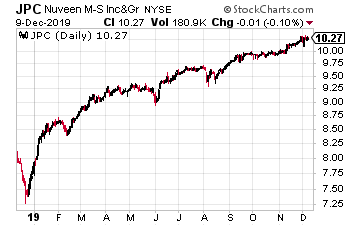
Nuveen Preferred Income Opportunities Fund (JPC) is a closed-end fund that owns a portfolio of debt securities and preferred stock. 79% of the portfolio has time to maturities for more than 20 years.
This is not the portfolio to own if long term rates start to increase. 55% of the portfolio is rated below investment grade.
In addition to the long maturities and low credit quality, the PRF portfolio is 34% leveraged. In a rising rate environment, the cost of leverage will go up, and that leverage will multiply the bond value drop.
This is a fund to sell if you think interest rates will go up in the next few years and is not worth the 7.2% yield.
Buy the #1 stock to turn $25k into tens of thousands of dollars for life
I’ve identified a stock that will be your cash register for the next 30 years.
But don’t just buy shares to claim your income. Do this one thing with this one stock.
Category: Stocks To Avoid


