Small-Cap Value More Than Doubles Growth
 Co-CIO Francis Gannon discusses small-caps ongoing strength in 4Q16 and some key reversals for the asset class in 2016.
2016 was a terrific year for small-cap stocks that included some key reversals: The Russell 2000 turned around 2015’s negative result, value outperformed growth, and cyclicals beat defensives.
And the Rally Has Room to Run…
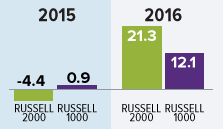
The Russell 2000 Index advanced 21.3% in 2016. This terrific result stood in stark contrast to 2015’s negative return. It also reversed two years of underperformance versus large-cap, as the Russell 2000 handily outperformed the Russell 1000 (+12.1%) and S&P 500 (+12.0%) Indexes. Strength for the asset class extended through 4Q16 when the Russell 2000 was up 8.8% versus a gain of 3.8% for both the Russell 1000 and S&P 500 Indexes.
Despite small-cap’s strong run in 2016, the Russell 2000 finished the year only 7.2% above its 6/23/15 peak. For additional context, it’s worth noting that small-cap upswings usually extend well beyond the Russell 2000’s 47.4% increase from its 2/11/16 trough through its interim peak on 12/9/16. There have been 12 declines of 15% or more for the Russell 2000 since its 1979 inception. The median return for the subsequent recovery period was 98.8%.
Small-Cap Up Rally Remains Far Short of the Historical Median
Small-Cap Up Market Performance after a Decline of 15% or Greater Since Russell 2000 Inception (%)
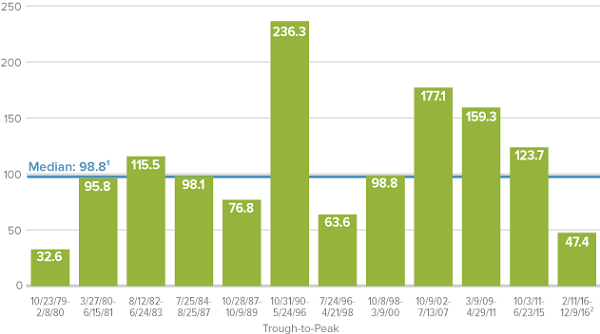
1Median includes only full recovery periods
2Interim peak
Our Outlook: Based on history, we see more running room for small-caps. The market and economic environments look promising. The current cycle has also seen more return dispersion and declining correlation, a steepening yield curve, and an increase in bankruptcies—all signs of growing normalization.
In fact, we firmly believe that we have turned the page on the anomalous 2011-2015 period, in which extraordinary monetary accommodations caused financial markets to behave in odd and unprecedented ways. In our view, we are on the road back to a more historically normal market environment. We think all of this bodes well for small-cap stocks.
Small-Cap Value More Than Doubles Growth
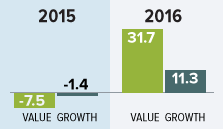
The Russell 2000 Value Index also rebounded dramatically in 2016, finishing the year with a gain of 31.7% versus 11.3% for the Russell 2000 Growth. Small-cap value got a lift from a very strong 4Q16, including an impressive post-election run, increasing 14.1% in the quarter versus 3.6% for its growth sibling.
A number of small-cap areas benefited from the escalating rally, consistent with the widespread sector strength that characterized most of 2016. Micro-caps continued the strong run that began for them in 3Q16 while very cheap stocks (based on free cash flow or sales) and dividend payers were both among the best performers within small-cap in 4Q16.
Our Outlook: After underperforming small-cap growth in six of the last seven years prior to 2016, small-cap value looks well-positioned for ongoing—and long-term—leadership, consistent with its historical advantage over small-cap growth. Based on our experience through more than four decades of cycles, both economic and market signs suggest a sustained run for value, somewhat similar to what we saw following the Internet Bubble.
Rebound for Small-Cap Value Seems Likely to Continue
Russell 2000 Value vs Growth Annualized Trailing 10-Year Relative Return Spread as of 12/31/16
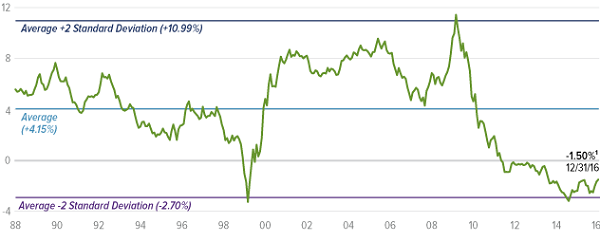
Small-Caps
1The 10-year average annual total return through 12/31/16 was 6.26% for the Russell 2000 Value and 7.76% for the Russell 2000 Growth. -1.50% represents the difference.
Standard Deviation is a measure that quantifies the amount of variation or dispersion in a data set. Roughly 68% of the data values are within one standard deviation of the mean.
Cyclicals Outpace Defensives
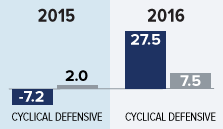
Like small-cap value stocks (with which they tend to overlap), cyclicals reversed a long-running underperformance trend of their own by substantially outpacing defensive sectors in 2016. Unsurprisingly, their advantage was enhanced by the post-election acceleration.
The best-performing sectors within the Russell 2000 were Materials, Financials, and Industrials—all cyclicals. In fact, Health Care—a defensive sector—was the only sector in the index to post a net loss in 2016. The top-10 performing major1 industries within the small-cap index came from cyclical sectors, while five of the bottom 10 major1 industries came from defensive sectors.
Our Outlook: In our view cyclicals look well-positioned for ongoing leadership. Financials are benefiting from a steepening yield curve that should help to lift bank profits, while the potential for increased economic growth is boosting Industrials and many Materials stocks. The latter are also benefiting from rebounding commodity prices that are fueling Energy stocks as well.
In addition, the U.S. consumer is spending. We see all of these as potentially ongoing trends. Although the global outlook is admittedly less certain, any rebound in worldwide industrial activity would also be a significant positive.
Cyclical Industries Lead, Defensive Industries (Mostly) Lag in 2016
Top Three and Bottom Three Major1 Industry Returns for 2016 (%)
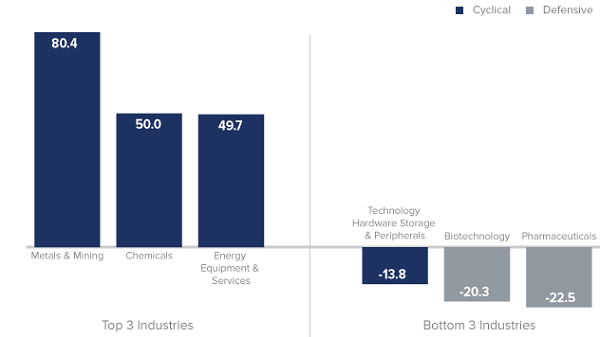
1Excludes industries which represent less than 0.5% of the Russell 2000.
Small-Cap Rally Accelerates, Investors Still Cautious
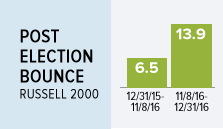
To be sure, 2016’s post-election rally was among the strongest following a presidential contest, marked by a rotation away from safety—bonds and defensive stocks in particular. Investors are showing increased confidence in the potential for improved economic growth and the policy shift from monetary to fiscal, chiefly in the form of tax cuts and projected spending increases on infrastructure and defense. This may help to ultimately reverse a fourth trend—that of U.S. equity vehicle net outflows.
Our Outlook: From our perspective as small-cap specialists, we see several changes that could benefit the asset class, including a lower corporate tax rate that would give many small-cap companies a relatively larger benefit thanks to their primarily domestic focus. The prospects for increased Capex spending as a result of repatriation are also encouraging. Finally, and perhaps most important, animal spirits seem to have been rekindled, judging from our recent conversations with management teams.
The critical question going forward is, how much of this has already been priced in? An intra-cycle correction would not be surprising—they’re a normal and healthy part of any cycle. However, 2016 saw $38 billion in net outflows through the end of November from passively and actively managed open-end mutual end funds and ETFs, which is not what we would expect to see at or near a market top.
In addition, the fact that the market seems to be acting in a more historically familiar way should play a large role in keeping investors focused on prudently managed, conservatively capitalized companies that are making progress in improving their competitive positions and their profitability. We welcome the renewed attention on these fundamentals.
2016 US Equity Outflows Are Opposite of Prior Market Peaks
US Equity Funds Net Flows including open-end mutual funds and ETFs ($B)
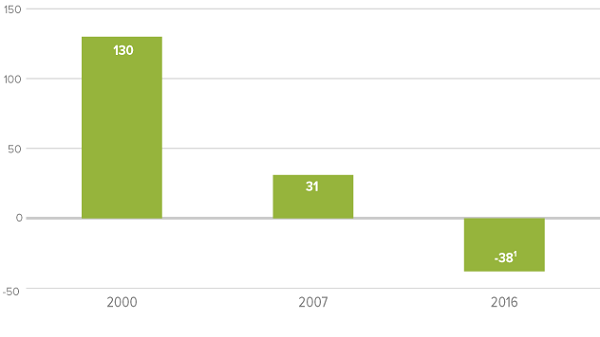
1Year-to-date through 11/30/16
These numbers include passively and actively managed open-end mutual funds and ETFs in the following categories: Small Blend, Small Growth, Small Value, Mid-Cap Blend, Mid-Cap Growth, Mid-Cap Value, Large Blend, Large Growth, and large Value.
Source: Morningstar Direct
Note: Article by Francis Gannon, The Royce Funds. Francis is a contributor to ValueWalk.com.
Category: Investing in Penny Stocks


