Is Small Cap Strength Sustainable?
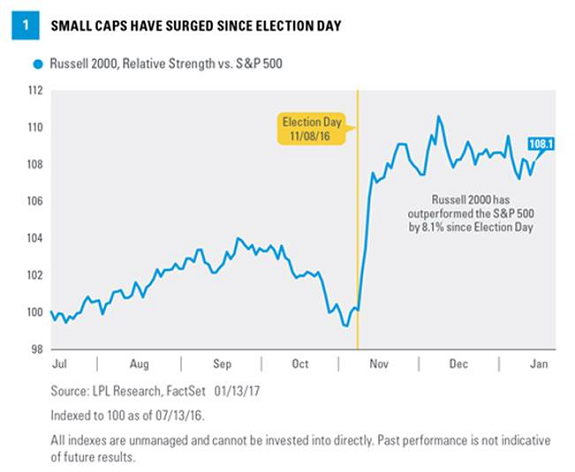
 Small caps have surged since Election Day. As shown in Figure 1, the small cap Russell 2000 Index has outperformed the large cap S&P 500 by 8.1% since November 8, 2016. The relative strength has been driven by several election-related factors, including prospects for corporate tax reform, deregulation, and President-elect Donald Trump’s efforts to encourage U.S. manufacturing and discourage offshoring. Here we share our thoughts on the potential policy impact on small caps and discuss whether recent small cap strength is sustainable.

Small Cap Strength
Small cap stocks may be subject to a higher degree of risk than more established companies’ securities. The illiquidity of the small cap market may adversely affect the value of these investments. The Russell 2000 Index measures the performance of the small cap segment of the U.S. equity universe. The Russell 2000 Index is a subset of the Russell 3000 Index representing approximately 10% of the total market capitalization of that index.
Election-Driven Rally
Small caps have benefited from the election results in several ways. First, smaller companies pay higher corporate tax rates than their larger cap counterparts that benefit more from lower overseas rates. The median corporate tax rate for the companies in the Russell 2000 is 33%, compared with 29% for the large cap S&P 500. That means smaller market cap companies have more to gain from a reduction in the U.S. rate, believed to arrive later this year.
Smaller cap companies also have more to gain from the Trump administration’s efforts to bring more offshore manufacturing back to the U.S. Although some low value manufacturing won’t ever be brought back, proposals from Trump and congressional Republicans have suggested more favorable tax treatment for companies with U.S. production. The president-elect’s social media campaign to discourage offshoring is likely to continue and generally hurt larger companies, potentially to the benefit of smaller U.S.-focused suppliers.
Small cap stocks may also benefit from a more favorable environment for mergers and acquisitions (M&A) under Trump. Deal activity slipped in 2016, with 10% fewer acquisitions announced compared with 2015, according to FactSet data. We would not be surprised to see M&A pick up in 2017 due to a more favorable regulatory climate for deal approvals, a clearer policy roadmap, and the hundreds of billions of dollars likely to be repatriated back to the U.S. because of a lowered tax rate, a highly probable piece of the Trump/Republican tax plan.
We should point out that repatriation of overseas cash benefits larger multi-nationals more than smaller cap companies with less overseas revenue and less cash trapped overseas for tax reasons. We expect a sizable portion of the more than $2 trillion in overseas cash to be used for acquisitions, in addition to share repurchases and capital expenditures.
Small business owners have responded to these proposals, and the potential for deregulation, pushing the National Federation of Independent Business (NFIB) Small Business Optimism Index up a record 7.4 points in December to a 12-year high and the strongest year-over-year gain (10.6 points), since October 1983.
Economic And Stock Market Sensitivity
Small cap stocks have also benefited from their sensitivity to economic and stock market performance. Though partly election related, the improved U.S. economic growth outlook has helped drive outperformance of the most economically sensitive (cyclical) sectors.
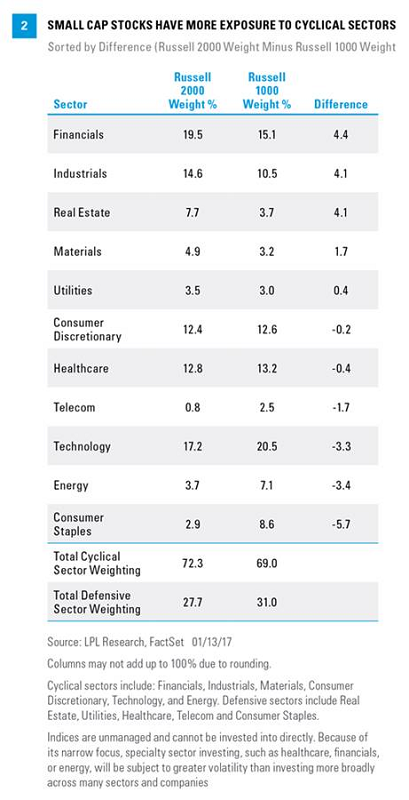
The small cap Russell 2000 Index includes a 72% weighting in cyclical sectors (consumer discretionary, energy, industrials, materials, technology, and financials), compared with 69% for the large cap Russell 1000 Index [Figure 2]. Accordingly, when cyclical sectors outperform defensives, which tends to correspond to a rising broad stock market, small caps’ relative performance tends to be better. Financials, industrials, and materials each have higher weights in the Russell 2000 than the 1000, while the defensive consumer staples sector’s weight is much higher in the Russell 1000.
Small cap stocks also tend to fare better than large caps when the broad stock market rises. For example, since the stock market lows on February 11, 2016, the small cap Russell 2000 has outperformed the large cap Russell 1000 by more than 18 percentage points (43.9% vs. 25.6%). During the seven months prior to that, from June 30, 2015, through February 11, 2016, as economic conditions deteriorated, oil collapsed, China growth fears intensified, and markets and the Federal Reserve (Fed) were severely misaligned, large caps outperformed by 11.2% (-23.9% vs. -12.7%).
Looking further back, over the past 20 years, when the large cap Russell 1000 Index rose over a three-month period, the small cap index outperformed by an average of 0.78% (3.1% annualized).

Credit Sensitivity – A Blessing And A Curse
Small cap companies tend to require more access to credit markets to fund their businesses, compared with large cap companies with their typically stronger balance sheets. As such, when credit markets are healthy or improving, which tends to coincide with rising equity markets, small cap stocks have historically performed well. Conversely, when credit markets deteriorate, which typically tends to be accompanied by stock market declines and higher volatility, small caps tend to lag behind large caps.
The current environment with narrow credit spreads (investment-grade corporate bond yields relative to Treasury yields) and relatively low stock market volatility is favorable for small cap companies. We expect credit markets to get even looser after Trump and the Republican Congress take steps?—?likely in 2017?—?to ease capital requirements for banks to promote lending (though not necessarily for the biggest, systemically important institutions). The problem is that spreads tend not to tighten much further given where we are in the business cycle, and stock market volatility may revert back to normal levels, both negative for small caps.
In sum, while forecasting the timing of credit market fluctuations and market cap rotations is very difficult, we think the credit sensitivity for small caps is likely to be positive for at least the next several months; later in the year we believe periods of underperformance by small caps are more likely.
Trade And U.S. Dollar Sensitivity
The greater U.S. focus for small caps should better insulate them against potential protectionist trade policy. The Russell 2000 generates approximately 20% of its revenue overseas, compared with about 35% for the large cap S&P 500.
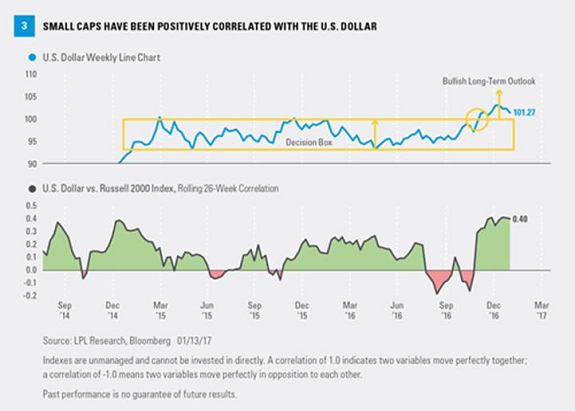
Because of their greater U.S. focus, small cap stocks tend to do better in strong U.S. dollar environments. As shown in [Figure 3, bottom panel], small cap stocks and the U.S. dollar have mostly moved in the same direction in recent years (a positive correlation, shown in green, indicates that two variables move in the same direction; red indicates the two variables move in the opposite direction). The relationship has been particularly strong since Election Day, although some of the correlation may be spurious, i.e., driven by other factors. For example, small cap strength may have been driven more by prospects for a lower corporate tax rate than a strong dollar.
The U.S. dollar (based on the DXY Index, representing a basket of foreign currencies) is up 3.4% over the past three months and 4.9% over the past six months. From a technical perspective, the DXY Index has broken out of a decision box to the upside [Figure 3, top panel], suggesting a bullish long-term outlook. Fundamentally, we expect modest upward pressure on the greenback as the Fed hikes interest rates and inflation pushes longer-term rates higher.

Risks
We noted in Outlook 2017: Gauging Market Milestones that small caps may outperform early in 2017 due to supportive policies and expanding bank credit under a Trump presidency. However, we also noted that an aging business cycle may favor larger caps later in the year. With the bull market and economic expansion both about to enter their ninth year, we believe we have entered the latter stages of the business cycle. That does not mean we expect a recession in 2017 or even 2018. It just means the risk that the stock market prices in a recession at some point in 2017 has risen (it got very close in early 2016).
Pro-growth policies such as those that Trump has proposed have the potential to bring forward the end of the cycle by accelerating the formation of excesses in the economy that could end the cycle. Bottom line, we may become more cautious on small caps as the year progresses.
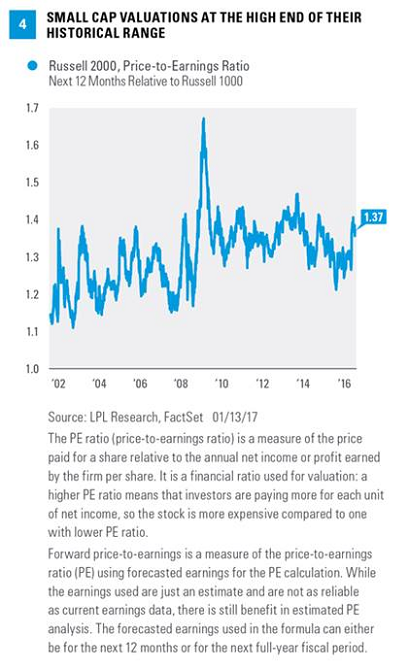
Our other concern is valuations. Figure 4 shows that on a forward price-to-earnings ratio (PE) basis, the Russell 2000 Index is trading at a 37% premium to the Russell 1000 Index. Add in that large cap PE ratios are above their long-term averages and small cap stock valuations are on the high side. The Russell 2000 Index is, however, expected to deliver faster earnings growth?—?double based on current consensus estimates?—?than the large cap Russell 1000 in 2017 based on FactSet-tracked consensus estimates.
Also keep this in mind. Over the past 25 years, the correlation between the PE of the Russell 2000 and subsequent one-year returns is essentially zero (0.04 to be exact). In other words, valuations are poor predictors of short- to intermediate-term small cap stock performance.

Bottom Line
Small caps offer a lot to like. We believe the policy environment, most notably the prospect of lower corporate tax rates, is strong enough to support further gains for small caps. The strength of the cyclical sectors, healthy credit markets, prospects for an M&A rebound, and the potential for further gains in the U.S. dollar also support a positive view. However, given the magnitude of small cap outperformance, and the risk of a bout of market volatility, investors with previously established small cap allocations may want to consider waiting for a dip before adding to positions.
Note: This article was contributed to ValueWalk.com by LPL Financial.
Category: Trading Penny Stocks


