What Stock Charts Technical Analysis Can Tell Us About The Penny Stock Markets
 This Is Critical… Looking At Penny Stocks Charts Technical Analysis
When was the last time you looked at a penny stock chart’s technical analysis?
If you’re like most investors, you fall into two camps… those that follow technical analysis… and those that follow fundamental analysis.
I’m a bit different…
I follow both. Each has their strengths and weaknesses. And you can learn a lot from each method of penny stock analysis.
If you follow my writing, you know I’m constantly watching the markets.
And there’s one indicator I follow above all others… the Russell 2000 Index.
Penny Stock Charts…
One of the best sources to track the overall performance of the penny stock market is the Russell 2000 index.
The Russell 2000 (in case you don’t know) is an index or a group of companies. It’s made up of the smallest 2000 companies tracked by the Russell 3000 index.
Is it perfect? No.
Unfortunately it has a lot of stocks that we’d consider too big for our penny stock investments. They’re not all penny stocks… or even small cap stocks.
So, why keep looking at this index?
I like to follow the Russell 2000 index because it’s the closest thing we have to a penny stock index. And it has a long track record. So it’s important to use this information to our advantage when looking at trends.
The Russell 2000 index is better than nothing.
Using The Russell 2000 Stock Chart For Technical Analysis…
There are thousands of ways to do technical analysis… and I like to keep it simple.
I watch the index and its 200-day moving average to track the overall trend in the market. And every few weeks I look back at the data to make sure I didn’t miss anything.
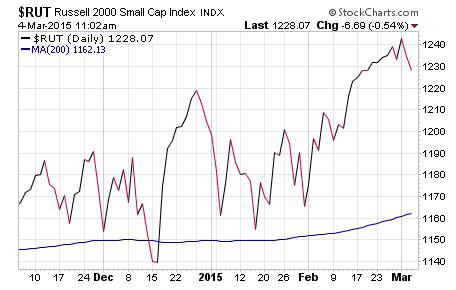
Just look at the chart from the last four months…

As you can see, the Russell 2000 has been bouncing around a bit… but when you look at the 200-day moving average (the blue line), you see it was essentially trading sideways.
So I keep my eye on this to look for changes.
I was nervous the chart might turn negative back in December… but as you can see, we’re trading above the trend line… and the trend line turned higher at the end of February.
That indicates we still have room to run on the markets for Penny Stocks!
So, if you’re looking at penny stock charts and trying to figure out technical analysis… keep an eye on the Russell 2000. It’s a great chart to watch for long term trends!
Good trading…
Brian Kent
Note: Brian Kent has been trading the markets for more than 2 decades and now writes and edits for PennyStockResearch.com. You can sign up for the penny stock research newsletter a trusted source for the truth about penny stocks! Sign up today and get a free research report – http://pennystockresearch.com/free-reports/.
Link the last phrase to:
Category: Trading Penny Stocks


